So earlier this week I WARC published the first of a two part article shining a light on an insight that i alighted upon around 6 years ago. The aim of this article was to get this out into the public domain alongside a number of practical applications that would help people use it. The article is here
I chose WARC because the bar to get published is high and it’s also THE journal of record for Marketing effectiveness. It also provides reach, because this is a pretty impactful piece of research that we all should be using.
The feedback has been phenomenal but; many have said they cannot access the article because it’s behind a paywall. I cannot post the article here in full because of copywrite (and neither would I) but there are certain principles that i can and will. Thats what this post is about!
So what is the metric?

Which might seem a bit uninspiring!

And that with a few small tweaks in EXCEL (or other common garden spreadsheet package) you could open up a world of relative performance analysis and contextual understanding for your brand or business vs its competitors in category!

So first step is to work out who the number 1 player in your market is and in Google Trends type that one in first. This is your BASE and is the brand against which all the others will be measured. Then add in your brand and the other competitors in market.
You’re limited to 5 at a time so just make sure you download the data before changing your brands BUT remember to keep the BASE (biggest brand) in.

The next part is some simple manipulation in excel. You’ll have c180 cells per brand if you use the “go back to 2004” option and this may “jump around” a bit. So to smooth it out turn that data into a 12 month moving average.

So what you should have is 168 data points per brand now but it’ll show a smooth line for each over time. Total this number for each Month (that represents 12 months average) – Still with me?

Simple maths here. Divide each brand by the total of that month. When i’m in excel I have the months down the side and the brands at the top. You can then just stack the various calculations without losing anything.
So this is the BIGGY now

Yep you’ve discovered Share of Search……………………………………………….. and when i use it in this sense i don’t mean like you would in PPC or SEO. This isn’t Share of Search as an input its Share of Search as an OUTPUT. This is important because THIS Share of Search (SoS) is a proxy for something quite important and in reality its a pretty simple calculation to do.

And why is Share of Search (SoS) important? Its because its an accurate proxy for Share of Market (SoM)

Thats a good observation but what is the INSIGHT?

To those who question whether people search for FMCG products, well i’ve got news for you. They do. And even if the volumes aren’t as great as say Nike or Apple they will display “relative patterns” i.e. bigger brands have more searches!..
So this is good and I’ve validated multiple times. Here are a few examples but for more the WARC paper has them and a full list of the categories analysed.
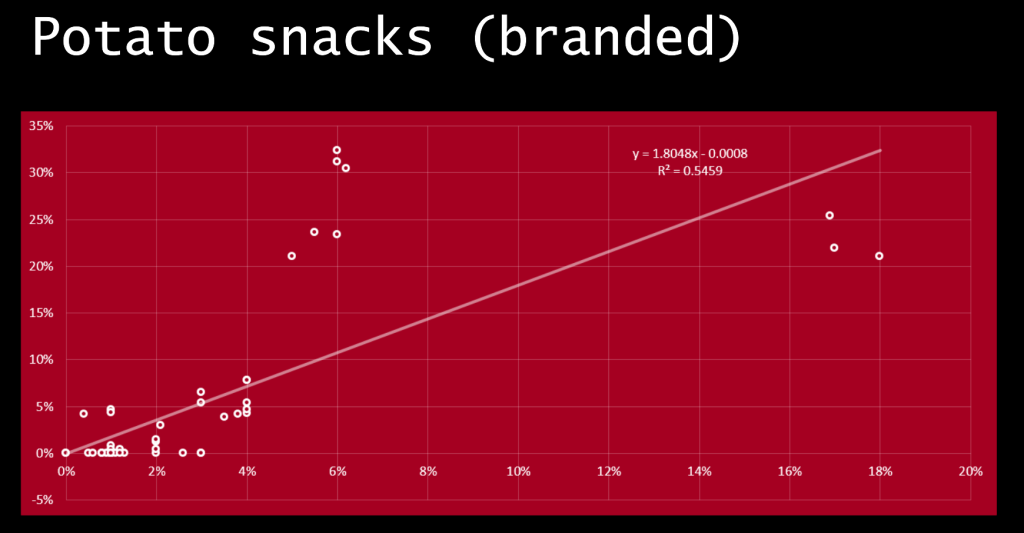


Now. I know the quants amongst you may be getting twitchy now. At a category level the simple linear regression certainly looks decent (and strong) but at a brand level there are some outliers. The key here though is that whilst there is some variance the trajectory movements are pretty accurate.

Which means that you have a mid-to-long term proxy of business performance relative to the competition AND it’s also available to everyone. Now, I’ve noticed that some have suggested this is predictive. It kinda is and kinda isn’t. The use of a 12 month average means that any single month has a limited impact on the rolling figure, ironing out the kinks. This means that performance MUST make enough of a splash over a number of months to register (changes in Market Share are slow moving after all) but it also has to do that relative to all the other brands and the category. So if the impact is BIG enough to shift the 12 month dial then obviously the impact will remain in place for a period (so its kind of predictive but not really) i.e. positive or negative trajectory is “fixed” for a period.
Its worth thinking at this point too about buyer behaviour and the known models/laws such as NBD-Dirichlet, double jeopardy, buyer moderation etc like any good strategist would to make sure we know what’s going on with the human beings engaged in buying behavior because like any analysis you have to engage the brain. If something looks odd then investigate it and hypothesise an explanation. When House of Fraser was in the process of going bust its SoS went through the roof and we know that was nothing to do with revenue generating actions!
Obviously I go into this a lot more depth in the WARC articles as this also opens up a wealth of analysis techniques and methodologies I hope to share some of these in subsequent blog posts.

Hey there, great article! I just have a question regarding the methodology. I have input my base brand and four competitors, then changed the four competitors leaving in the base brand. But the values for my base brand change with the new competitors for the same time periods. Wouldn’t this make the first and second sets of competitors not comparable?
LikeLike
Hi Lucia. Please drop me a line on hankins_jcp@hotmail.com. thanks
LikeLike
Saw you speak on this the other day with Les Binet for the IPA. Enlightening stuff. Especially interested in applying it to supermarkets – would love to know what’s going on with Asda/Sainsbury’s.
On a practical note, do you get your market share data from Kantar Worldpanel? And if so, do you have to manually go back in 12 week intervals to get it all?
LikeLike
Hi Hal. Drop me a line on hankins_jcp@hotmail.com
LikeLike
Hi James, read this post over a few times and couldn’t quite understand it. Reckon you’d be able to share some screen grabs or annotated keyframes from google? When you/ Les say “divide by the total number of searches”, what does this mean exactly? What is the total number of searches? Thanks
LikeLike
the index. so if you total the value of the indicees then calculate your brands % against this…
LikeLike
Hi James,
thank you so much for your tutorial on how to apply this. Unfortunatly I am truly struggling to come up with an alalysis anywhere near your R square results. Did this for different categories and I believe the data I am working with to be okay.
Is there any specific watchout when doing this analysis? Does my data need to be longer than 12 months on a weekly or monthly basis?
Any information you could provide is very appreciated. My head is close to explode… 🙂
LikeLike
missed this. Hmmm. its rare for it not to match. Are the brand terms the right ones? What are the proxies for market share?
LikeLike